So, you’ve got a firmware dump. Perhaps a raw read off a chip? An update file you downloaded off the internet? Now what?
Taking a firmware d/ump and turning it into something useful can sometimes be painful. Sometimes you’ll be faced with proprietary (barely documented) file formats, strange raw data quirks, or even encryption.
Let’s go through some strategies for getting useful data out of a firmware dump.
Context is everything
It’s ALWAYS useful to remember the context of the file you’re working with. Do you know what chip it’s supposed to be running on? What’s the architecture? Little or big endian? Do you know if it’s running an RTOS? Is it running Linux? Just bare-metal?
Context will help guide you towards the right tool for the job. Running binwalk on SREC-encoded firmware for an RH850 is unlikely to help anyone. Similarly, trying to load the ROM filesystem for and embedded Linux-based SoC directly into IDA is a mug’s game.
Binary or ASCII?
So, what in the file? Is it literally ASCII strings? Or a blob of binary data? Have a look. Use head, cat, hexdump, or your favourite GUI text editor.
If the device you’re targeting runs a bare-metal MCU, you might find that the firmware files are distributed in text files, with the bytes literally transcribed as hexadecimal (often with some prepended identifier codes and/or address offset/location, and possibly an appended checksum on each line). Before you can do much with these files, you’ll first need to get them into a binary format. There’s a few common file formats you might come across:
Motorola S-Record
Sometimes known as SREC. All S-record file lines start with a capital S. A full breakdown of the format can be found here.

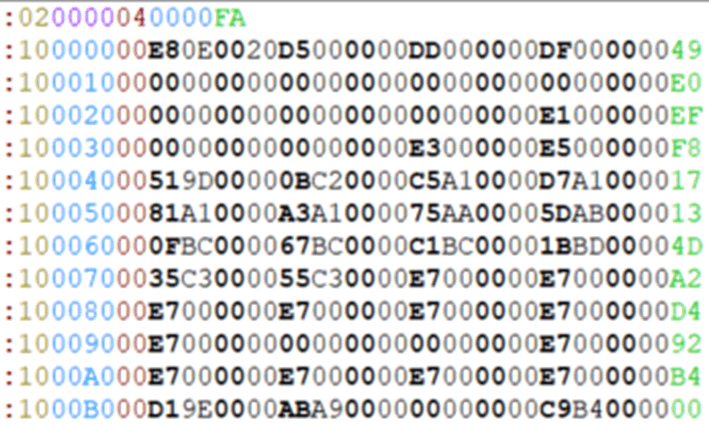
Intel HEX
A similar vibe to SREC, Intel HEX lines all start with a colon.
TI-TXT
TI-TXT is a Texas Instruments format, usually for the MSP430 series. Memory addresses are prepended with an “@”, and data is represented in hex. It looks roughly like this:

All Motorola S-record, Intel HEX and TI-TXT files can be converted to binary using the bincopy python library.
Raw NAND dumps
Data is stored in a weird way on a NAND chip. Well, it’s not that it’s that weird, it’s actually clever and useful when the data is still on a NAND chip, but you still need to do some pre-processing before you’ve got anything usable off-chip.
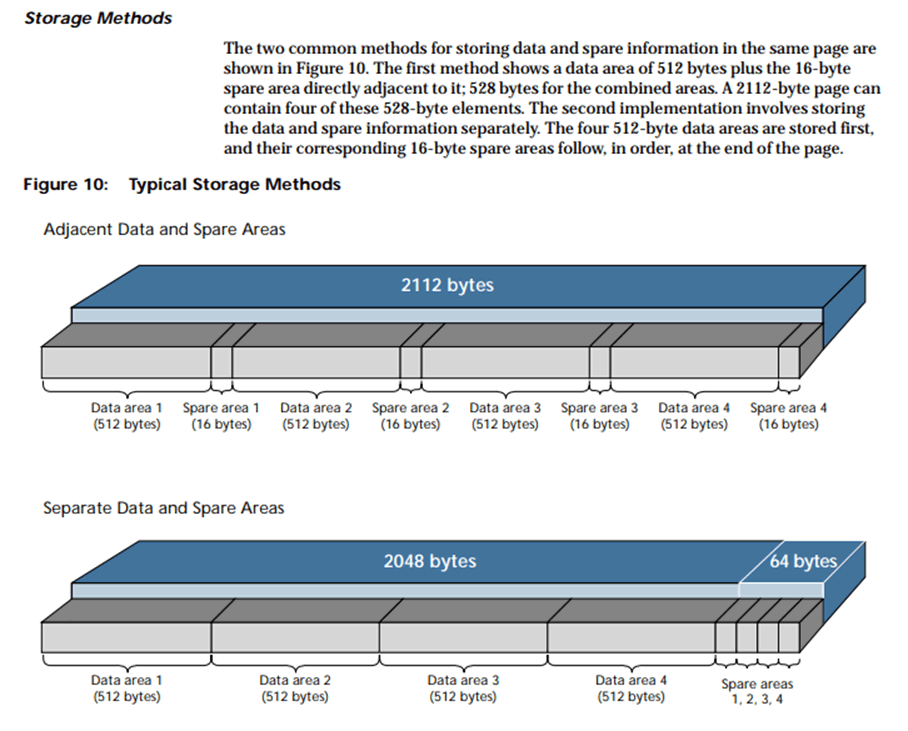
Out-of-band (OOB) “spare” segments are inserted at the end of every page of data, or the end of each block, as you can see above. They’re there for the controller to keep track of bad blocks, erase counters, etc. But, if you dump the whole chip raw, you’re going to have these “spare” segments in the dump.
This means that you’re going to have to strip all these out of a raw dump before you have a contiguous file of the actual data you want. You can then start interrogating the dump with some of the strategies mentioned below.
I always, always end up going back to this amazing blog post on raw NAND dumps, every time I have to work with them. The author wrote an extremely useful tool called Nand-dump-tool.py, which should be used in conjunction with reading that post. There’s also the [Micron introduction to NAND flash](http://www.micron.com/-/media/Documents/Products/Technical Note/NAND Flash/tn2919_nand_101.pdf) (which is where the above image is from).
So, you got a binary? That don’t impress-a me much.
Once you got your firmware in a binary format, you can analyse it for interesting information.
Again, it’s useful to remember context here. If you know the firmware’s for a specific bare-metal MCU, you’ll likely just want to grab the datasheet and pull it straight into IDA. If you know that it’s for bare-metal, but you don’t have a datasheet, you might want to do some byte-level detective work. If it’s for a more complex system, with an operating system like Linux, you’ll probably want to get files out of it.
Regardless, the following tools are good all-rounders.
strings
strings is extremely useful for getting an initial lay-of-the-land. It will return a list of null-terminated strings of printable characters. It’s also more fully-featured than most people realise. A basic strings file.bin will return all ASCII/ISO 8859-encoded strings 4 or longer. But it can be a little more granular than that. Here’s a few other useful strings flags:
strings -n16 file.bin The default minimum length of a string is 4. The -n flag specifies the minimum length of the string to be returned. This example command prints any ASCII strings longer than 16 to stdout.
strings -el file.bin The strings -e flag specifies the encoding of the characters. -el specifies little-endian characters 16-bits wide (e.g. UTF-16). If the dump is encoded as big-endian, use -eb. 16-bit wide encoding can often be found in firmware for embedded Windows (or devices which run Mono somewhere).
strings -tx file.bin The -t flag will return the offset of the string within the file. -tx will return it in hex format, T-to in octal and -td in decimal. Very useful if you’re cross-referencing with a hex editor, or simply want to know where in the file your string is.
With the -n and -t flags, your output might look something like the following:
$ strings -n16 -tx file.bin
de1d73 vl1T-W4m% ]e7 ^")
14b3b12 K,E>$r!!qxc`    a~S
15715a8 hX3Y@<-Gb$r+G9[j
19717f0 hg9Dfs[31+.|~#y*4
3a223b5 v?_-=jO ?0n>#@[D
417fec4 s]pD(6X#_tD&-NN-
47667a1 dAsMJjD#=+x'LG4<b7
4d55401 =GKw]I6VCDuTGvsv
511ad94 HelloFirmwareFans
53ef9cc %z.rkn'-z:gVUUl1-i
548b9e0 oelinux123
5d1c7cf P~7^SLD0njEo:ALa+
The offset the string can be found at, in hexadecimal format, is the first field of each line.
hexdump
Run hexdump against a file, and you’ll get the hexadecimal representation of each byte returned to stdout. It’s literally a “hex” “dump”.
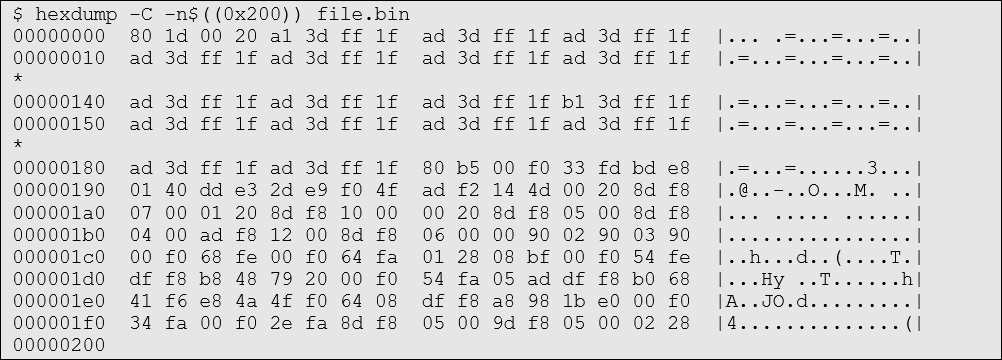
Many people I know are fans of the -C flag, which returns the file bytes in single-byte representation and adds a column showing printable characters (or full stop characters where not printable). That way it’s easy to pick out strings and get an overall sense of the binary.
hexdump also helpfully inserts a * character in lieu of repeating lines. You can turn this off with the -v flag, if you really want to see everything for any reason.
The -n flag can be used to limit the number of bytes returned. In the following example, 0x200 bytes of file.bin are hexdump’d with the -C flag.
file
It’s usually worth running file against a firmware dump (and anything you might have binwalk’d, dd’d or otherwise extracted out of it), just in case.
file works by checking the header of a file for magic bytes (just like binwalk) – although it only checks the first few bytes of the file it’s given.
An unidentified filetype will be reported as “data”. But any recognised file will be reported to be what file thinks it might be, along with useful metadata (if is parses). You can see this below when passing a JPEG image to file:
$ file file.bin
file.bin: data

$ file image.jpg
image.jpg: JPEG image data, JFIF standard 1.01, resolution (DPI), density 1200x1200, segment length 16, baseline, precision 8, 4578x4387, frames 3
Firmware dumps can sometimes be amorphous blobs containing multitudes of different filetypes – or they might be encrypted and start with completely random bytes, which may or may not correspond to a legit file magic byte sequence. In this case, just like with binwalk, you’ll end up with a false positive.
$ file file2.bin
file2.bin: PDP-11 UNIX/RT ldp
What is PDP-11 UNIX/RT ldp? I don’t know, but it’s definitely not what the firmware file is. All this tells us is that the first few bytes of the file correspond with PDP-11 UNIX/RT ldp files.
Running file * in the folder context can be really quick and useful. For example, running in the context of binwalk output can give an easy visual of what kind of files you’re working with. For example, binwalk might have found (and successfully extracted) a JFFS2 filesystem, and some other stuff. The binwalk output folder contents might look like the following:
$ file *
2042C4:       data
800000.jffs2: Linux jffs2 filesystem data little endian
jffs2-root:   directory
binwalk
binwalk is a solid and popular tool for working with firmware for devices which run some kind of OS. It gets talked about a lot, but it’s important to remember, binwalk is not the be-all and end-all of firmware analysis tools. It is, however, extremely useful and simple.
At a high-level, by default, binwalk iterates through all the bytes in a binary, looking for magic bytes. If finds one, it will report it on a table it prints to stdout.
It can also “carve” out (/extract) each segment it finds, so you can look at it in isolation. Use the -e flag to specify that it should extract files rather than print everything it finds to stdout. Extracted files all go into a directory called _filename.extracted (or _filename-[int].extracted, if that folder already exists), based on the filename of the file you’ve run binwalk against.
Due to the nature of what it does, you’re almost certainly going to come across false positives. The larger the file, the more likely you’re going to get false positives. It’s just likely that, by coincidence, a file will contain magic bytes in a given order which make sense to binwalk’s magic byte parser. It doesn’t mean that what it reports is valid.
So, when you’re using binwalk, you often need to at least roughly know what you’re expecting to see. So, if the device you’re looking at runs a flavour of embedded Linux, you’ll be expecting a ROM filesystem of some kind (maybe squashfs, cramfs or jffs2). You may also assume that you’ll see a zImage or uImage chunk. You might also be expecting to see a bootloader image.
Here’s an example of running binwalk on a massive, encrypted firmware file. There shouldn’t be anything of value in here, but binwalk still picks up quite a few possible candidates.

These are definitely false positives, the results based only on the coincidental fact that the magic bytes for these filetypes have ended up in the ciphertext. The “files” found at also at arbitrary offsets, which makes it even less likely they’re legit.
A sensible-looking binwalk output might be something like this:

There’s a uImage file (with seemingly same size, entry point, and image name), and a JFFS2 filesystem. Since the kernel is usually compressed as a gzip, it makes sense that binwalk would also find the gzip magic bytes just after the kernel header. Both kernel and filesystem would be needed to boot into embedded Linux. To put the cherry on top, both are found at very neat offsets (0x200000 and 0x800000). This won’t always be the case, but in this instance it’s heartening to see.
fdisk
Sometimes – especially if the device is relatively high-end and the firmware file is massive – the firmware is just a drive image. This is usually because the device is so resource-intensive it’s halfway towards being a desktop computer. Try listing partitions with fdisk -l, or fdisk -lu (the -u flag gives the partition size in segments instead of “cylinders”, which can be really misleading)
Here’s what the fdisk output looks like on a file which has no valid disk images inside it.
$ fdisk -l file.bin
Disk file.bin: 104.3 MiB, 109407232 bytes, 213686 sectors
Units: sectors of 1 * 512 = 512 bytes
Sector size (logical/physical): 512 bytes / 512 bytes
I/O size (minimum/optimal): 512 bytes / 512 bytes
A file containing some valid filesystems might return something similar to the following:
$ fdisk -l file.bin
Disk file.bin: 2.6 GiB, 2751447040 bytes, 5373920 sectors
Units: sectors of 1 * 512 = 512 bytes
Sector size (logical/physical): 512 bytes / 512 bytes
I/O size (minimum/optimal): 512 bytes / 512 bytes
Disklabel type: dos
Disk identifier: 0xcd42b400

Device     Boot       Start      End       Sectors Size Id Type
file.binp1 3892371390 4109164418 216793029 103.4G  72   unknown
file.binp2 3287936629 3304577640 16641012      8G  6    FAT16
Here you can see that a valid FAT16 image has been found starting at 3287936629 and ending at 3304577640. Its size is reported as being 8GB.
You can use these numbers to extract the filesystem from the firmware binary file using dd. Once you’ve extracted the filesystem, you can try to mount it with the appropriate mount command. Mounting filesystems can be its own kind of existential nightmare, and is a subject for another post entirely. But based on the reported type of filesystem, and by searching the web extensively for the right commands/tools, you will often be able to successfully mount these filesystems.
Again, remember context. In some cases, you may need to load kernel modules for a non-default filesystems (QNX in particular comes to mind).
If you’ve got a file containing lots of filesystems, and you want to extract them all at once, you can use something like the following one-liner:
fdisk -lu file.bin | egrep -i 'file.bin[0-9]' | sed 's/ */ /g' | while read line; do dd if=file.bin of=$(echo $line| cut -d' ' -f1) skip=$(echo $line | cut -d' ' -f2) count=$(echo $line | cut -d' ' -f4); donedd
Why are so many people afraid of dd? Granted, it’s horrifyingly easy to trash entire disks with it. But that’s only when setting of= to the wrong place. Be careful with that.
It is still, however, an extremely simple and effective byte-level copying tool. It’s particularly useful when using a shell which supports “dollar bracket bracket” arithmetic notation (e.g. $((0x40/4) ) = 16). This is extremely useful for converting hex to decimal on the fly, as well as doing basic arithmetic when working with different block sizes.
Key dd arguments you should know are:
if=[FILE] The input file. dd will read from this file.
of=[FILE] The output file. dd will output to this file.
bs=[NUMBER] Block size. All other numeric arguments to dd will be calculated as multiples of this number. The default block size is 512. Set bs=1 if you don’t mind things being slow, and can’t be bothered to do maths in the command.
skip=[NUMBER] Number of blocks to skip before reading the input file.
count=[NUMBER] Number of blocks in total to copy from the input file to the output file.
So, let’s say we want to extract a chunk from 0x200 to 0x400 from firmware.bin. We can run:
dd if=firmware.bin of=firmware.chunk bs=1 skip=$((0x200)) count=$((0x400-0x200))
If we wanted to run it a little faster, we could increase the block size:
dd if=firmware.bin of=firmware.chunk bs=$((0x100)) skip=$((0x200/0x100)) count=$(((0x400-0x200)/0x100))
Remember that dd works in blocks. So, you have to be quite precise with your calculations when specifying block size, and subsequent numbers. If you want to be safe (but slow), you can just use a block size of 1.
The GUI hex editor of your choice
When things are going pear-shaped, or you need a little more visibility, it may be useful to scout through a firmware dump in a GUI hex editor. I’ve never quite been able to find the hex editor of my dreams. I wish there was something which could visualise binary files, find valid bytecode for any given common architecture, visualise entropy including bytecode, allow note-taking and highlighting, list strings, etc, etc, etc. Anyway, you do the best with what we can get your hands on – some are better than others.
On a day-to-day basis, I tend to use HxD for the basic donkey-work, and wxHexEditor for note-taking and highlighting like so:
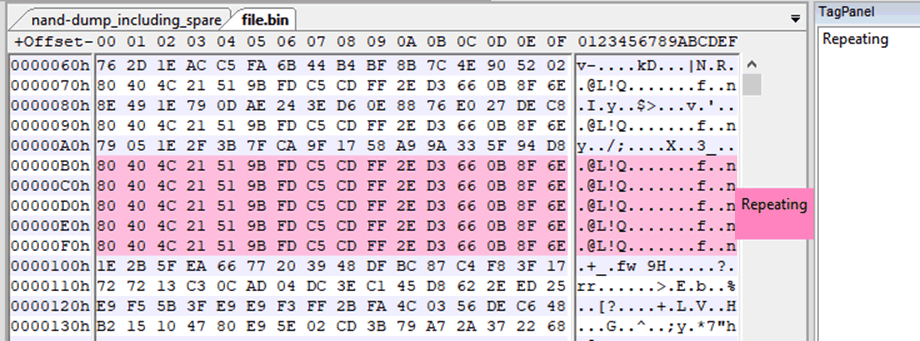
There’s a LOT of hex editors out there, so which one you choose to use will come down to personal preference. Try a few out and see how they feel.
Is it encrypted?
You may come up against a firmware file which is encrypted in some way. First, you’ll want to get a sense of whether the whole file is encrypted, or if it’s just a chunk. If it is encrypted, you may also want to get a quick sense of how well it’s done.
All of this is tricky to do just scrolling through lines and lines of bytes. It’s much better to try to get an overall picture of what the file looks like from a high level.
Calculating entropy is a really good way of getting a sense of how compressed or encrypted any given series of bytes is. High entropy = probably encrypted (or compressed). Low entropy = probably not. But, even given the numbers, it’s not always immediately obvious.
Visualisation tools are helpful to see entropy quickly. Here’s a few useful ones:
binwalk -E
binwalk has an in-built entropy calculator which outputs a 2D graph. It’s pretty decent at visualising entropy. But, since it’s in a 2D graph format, some of the nuances of the data might be lost.
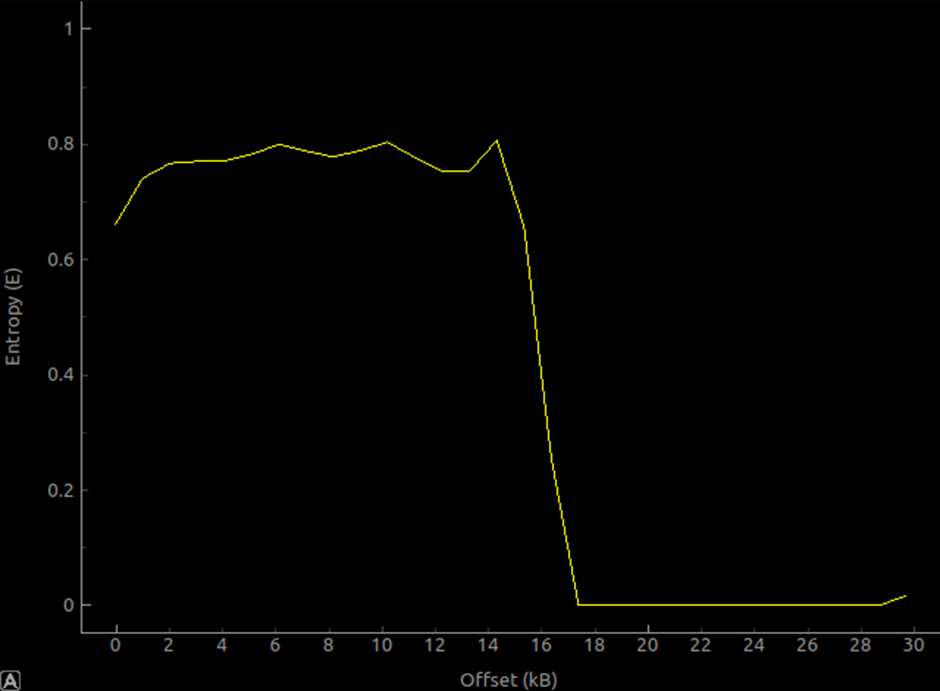
This is an entropy graph of an STM32F4 system bootloader. The fact that the first 16kb is predominantly bare-metal thumb bytecode (as well as the fact it’s probably been specifically condensed and optimised), makes the entropy calculation relatively high. But it’s nowhere near 1 still, so evidently not encrypted. The last 12kb is mainly just 0xFF bytes – therefore the calculated entropy is extremely low – close to 0 for most of it.
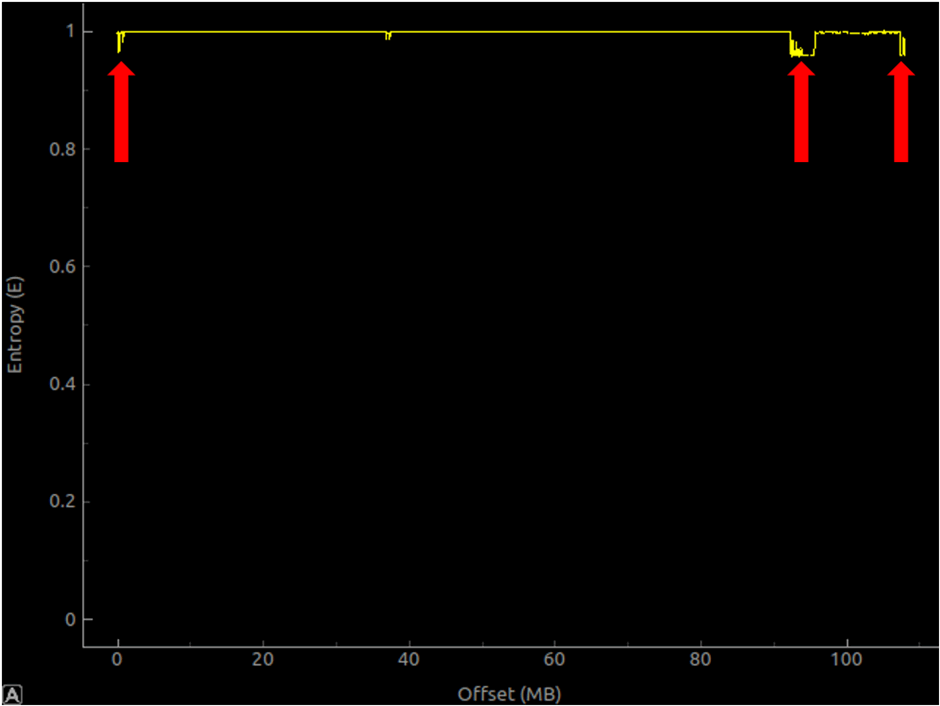
This is the entropy graph of a large (+100mb) firmware file, which is encrypted (to some extent!). The file entropy is mainly calculated to be very, very close to 1 (high entropy). But those slight dips (around 0mb, 90mb and right at the end) might suggest that the encryption is less-than-ideal. It’s worth following up on small suggestions like this.
binvis.io
binvis.io is a decent, full-colour binary visualiser. It works really nicely on smaller files, as long as you don’t mind uploading them to someone else’s server.
binvis standalone
There’s a (very underdeveloped) C# project also called binvis (confusing, I know!), which appears to have died a long time ago. It seems to have no relation to binvis.io, but it does work a lot better for offline analysis, and for large files.
In particular, the RGB plot – although not as flashy or specific about the binvis.io output – is useful for quickly seeing if there’s any obvious repeating patterns, or areas of lower entropy within a file.
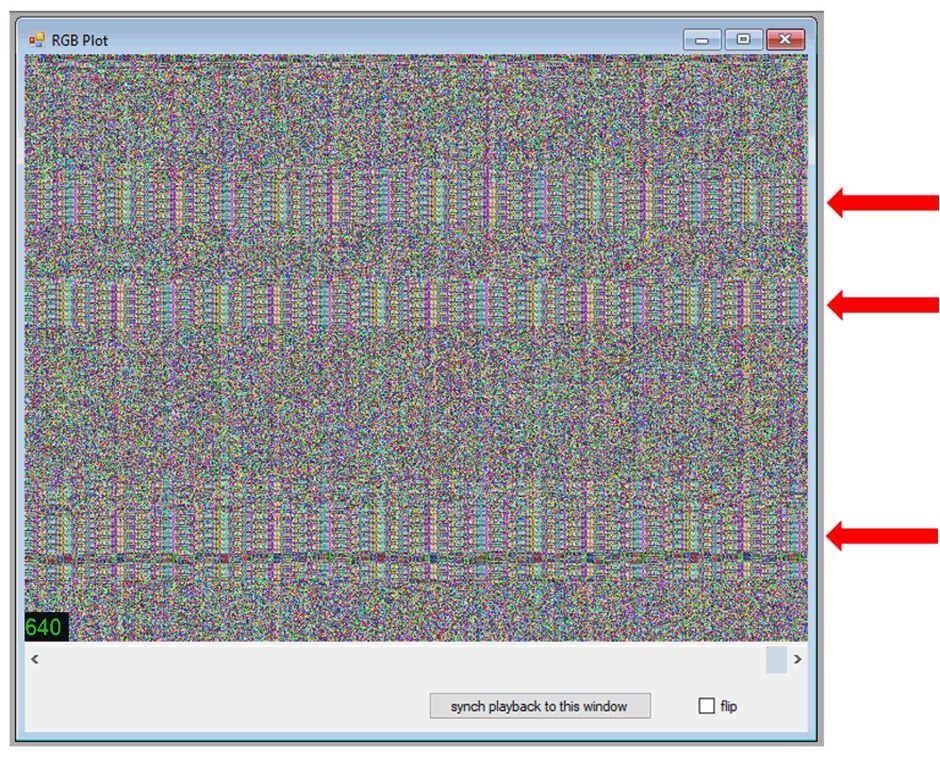
This example is of a supposedly-encrypted firmware file for a large router brand. It’s quickly obvious that the “encryption” may not be as “encrypted” as it should be. Where you see repeating patterns in firmware which is assumed to be encrypted in some way, you may actually be looking at XOR, the key for which could be relatively easily derived by statistical analysis (or, if you’re less lucky, you may be looking at something like AES in ECB mode, which is less trivial to break).
Encryption or Compression?
People smarter than myself have written about differentiating between encryption and compression using “maths”.
Bare-Metal?
Most of the tools above are great for working with firmware designed for SoCs with proper operating systems. But sometimes you’ll be analysing firmware for a bare-metal MCU. In that case, you need to consider other strategies for making sense of the firmware.
Datasheets!
If you can get hands on it, just read the damn datasheet. Don’t underestimate the value of a decent datasheet. I’m not talking about 60-page sales manuals, I’m talking a proper 1000-page+ programming manuals, in conjunction with manuals for the core processor.
Sometimes datasheets aren’t public, sometimes they’re “confidential” but available, sometimes they’re just sitting there on the official chip manufacturer websites waiting to be downloaded. Resources for finding datasheets might be:
- Google. Nothing better than a good Google.
- Yandex.ru etc. Don’t underestimate non-English-language search engines and forums.
- Alibaba. The chips are sold here. Some listings will link to datasheets you may not be able to find anywhere else. You may also have luck by speaking to vendors directly.
If you can’t find a datasheet – at the very minimum you will need to discern the entry point and the address the firmware is supposed to load at. You might be able to find answers by frantic Googling, reading forums, reading source code, or some other unexpected corner of the Web. If there are toolchains out there for the chip you’re targeting, then there may also be source somewhere, which may also lead you in the right direction.
In desperate cases (vendors who have brutal NDAs, very little useful info out in the wild) you may have to resort to digging through whatever you can get your hands on and go from there. You might, I don’t know, find a leaked compiled “flasher” tool from 2009, written in C++ and compiled for PowerPC, and have to reverse-engineer it. You may, also, at that point, just decide to give up and do something else. Take a walk. Change careers.
Loading bare-metal binaries into IDA
Yep, IDA is still the most useful (and universal) disassembler when it comes to bare-metal. It really deserves its own post entirely, when it comes to working with bare-metal binaries. But, as a general rule for analysing bare-metal binaries, you need to know the load address and the entry point.
The load address is the address in memory that the binary is being executed from. The entry point is the location within the binary where the processor starts executing.
Again, you need to remember the context for the firmware you’re analysing. Knowing the core and its idiosyncrasies can help a lot. If you’re looking at something running on a Cortex-M, you may find yourself deeply acquainted with infocenter.arm.com.
Let’s do an example. I’ll use a bare-metal ARM binary for this, just because bare-metal ARM is really common.
Let’s look at the system bootloader for the STM32F405. We’ve got one in our hands, we have unfettered memory access, we can dump anything, we’re good to go. The STM32 datasheets are all online, so we can find the one for the STM32F405 by doing some Googling.
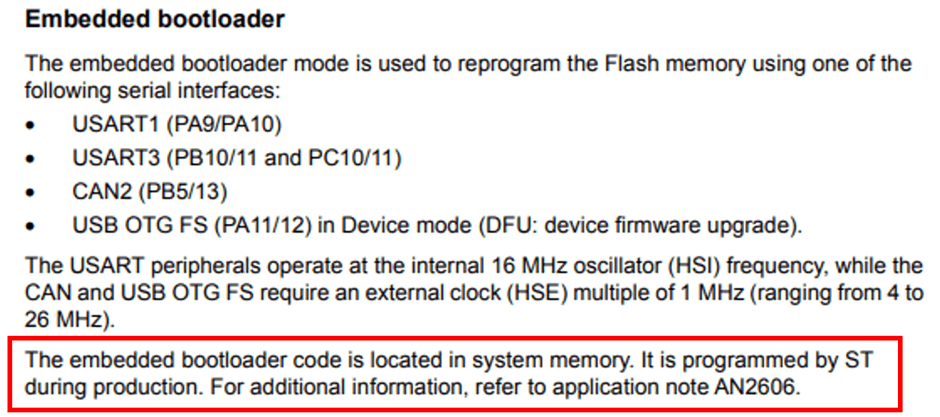
The datasheet says that the bootloader is located in “system memory”. Hmm, where’s that?
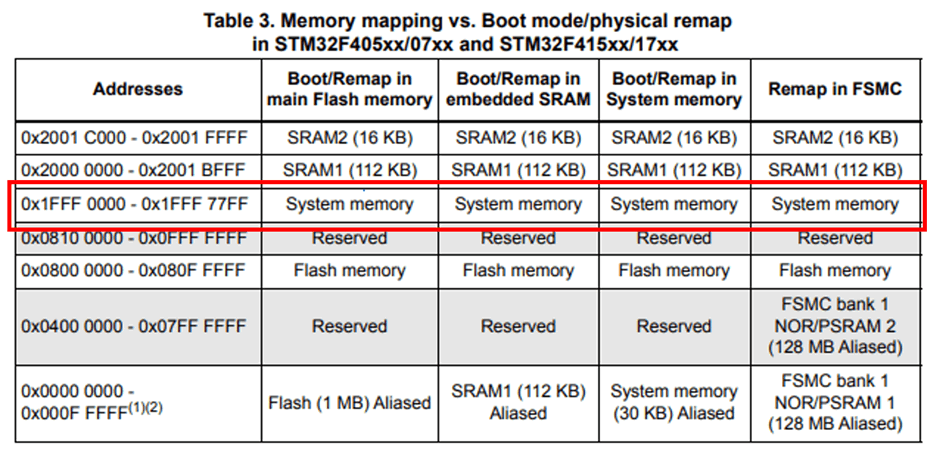
Ah! It says that system memory is at 0x1fff0000.
So, having dumped all memory from 0x1fff0000 to 0x1fff77ff to a file, we can do some quick sanity checks. Maybe check if there’s any strings in there:
$ strings -n5 stm32f405.bin
s F
1`hC1hA
rAh
CA`b{
pGZHJ
!1Ccs
[…snip…]
a`hK!Aa`h
QAarH@h
h@$@!
beta1
Quite a lot of trash, but one sensible-looking string. Perhaps other encodings will be more fruitful:
$ strings -el stm32f405.bin
@Internal Flash  /0x08000000/04*016Kg,01*064Kg,07*128Kg
@OTP Memory /0x1FFF7800/01*512 e,01*016 e
@Option Bytes  /0x1FFFC000/01*016 e
@Device Feature/0xFFFF0000/01*004 e
STMicroelectronics
STM32  BOOTLOADER
STM32F2STM32
"11
Yep, that’s a lot better. Also, very sweet of them to include a few memory references for us.
We can also (double) check what arch the code is compiled for, and what endianness (if you know STM32s/Cortex-M4s, you know it’s probably going to be Thumb, but let’s just check for completeness). For that, we can use binwalk (again).
binwalk has an alright built-in opcode scanner, which is activated using the -Y flag. It doesn’t do the normal binwalk magic byte-scanning activity. Instead, it just checks for valid instructions for all the major architectures using the Capstone engine and reports what it finds, including how many sequential valid instructions, the architecture and endianness. This is useful if you just want to run a quick sanity-check on some firmware you’re looking at, regardless of how much you think you already know.
Here’s binwalk running on a the STM32F405 bootloader we just pulled off the chip:
$ binwalk -Y stm32f405.bin

DECIMAL       HEXADECIMAL     DESCRIPTION
--------------------------------------------------------------------------------
0             0x0             ARM executable code, 16-bit (Thumb), little endian, at least 1079 valid instructions
It’s important to note, however, that binwalk -Y is just a dumb way of checking if a file contains valid bytecode. It doesn’t tell you anything useful about the firmware itself. It’ll just tell you if there’s valid bytecode in there.
What it tells us, it that from offset 0, the Capstone engine can read the bytes as valid little endian Thumb code. 1079 valid instructions – that’s quite a lot of code. We can then load the dump into IDA with this in mind.
Open the file in IDA, and you’ll see the usual popup. IDA won’t figure anything out for you at this point, so you need to change the “Processor Type” to “ARM Little-endian [ARM]” and click Set.
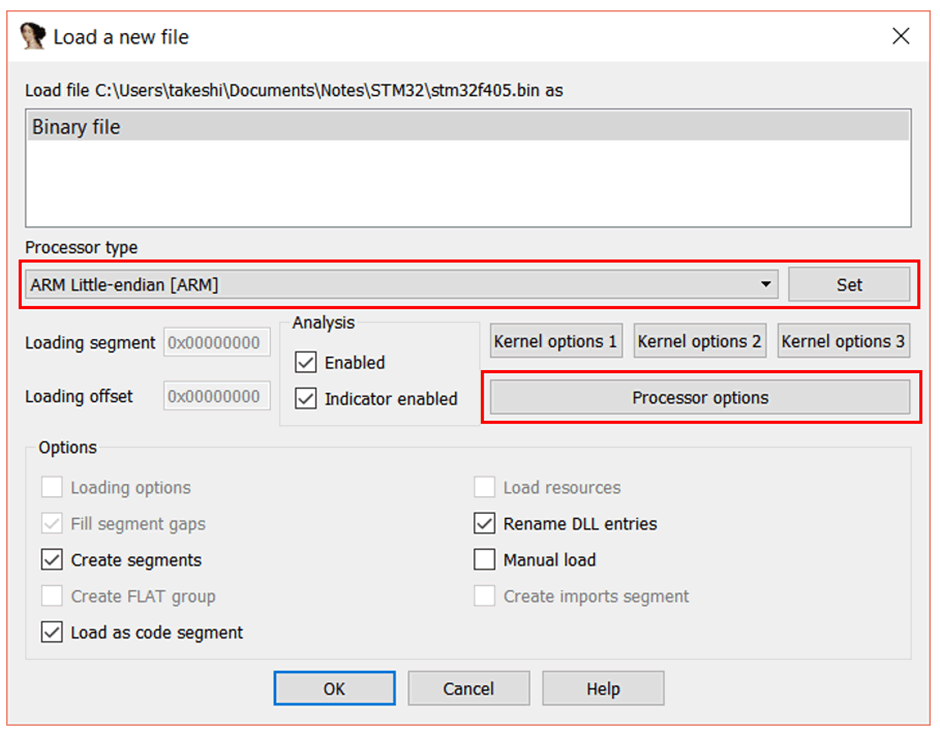
If you want to preclude ARM code (and just use Thumb) you can do the following:
Click “Processor options”, and the “ARM specific options” window will appear.
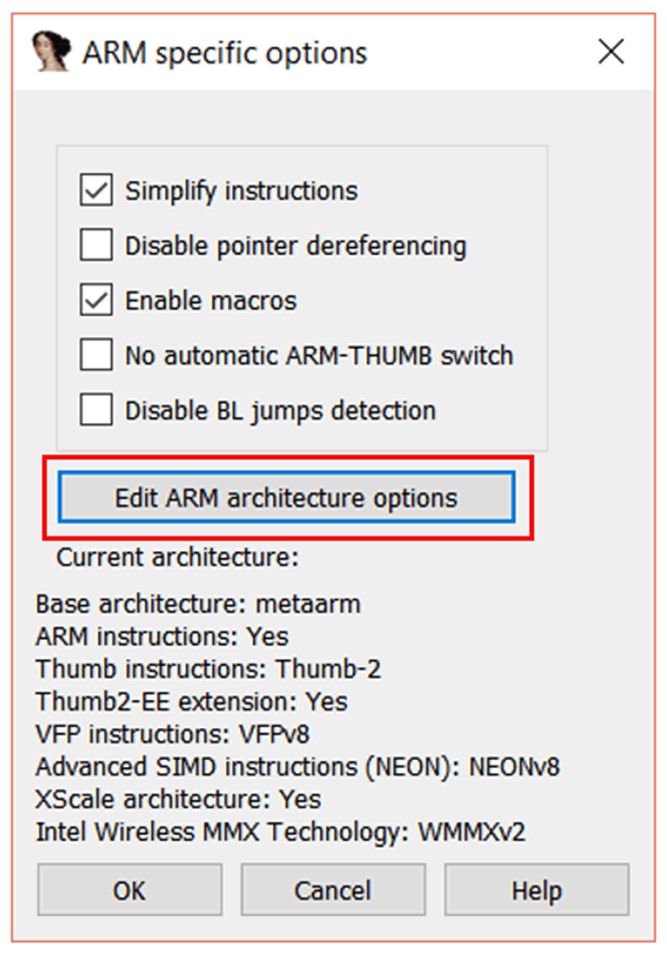
Click the “Edit ARM architecture options” button.
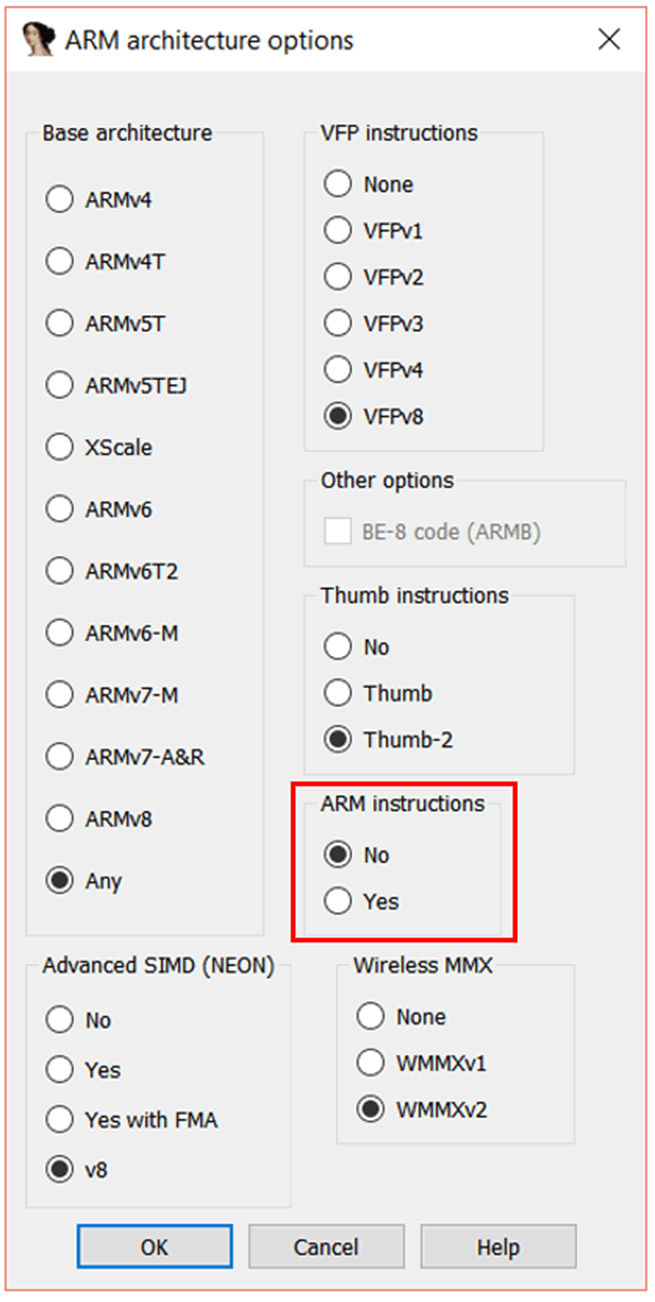
In the “ARM architecture options” window, set “ARM instructions” to “No”. Leave Thumb instructions as it is. Press “OK” “OK” “OK”, and IDA will prompt you again – this time to ask you to configure the memory.
We already know that the address the bootloader is pulled from is 0x1FFF0000. So we can enter 0x1FFF0000 in the ROM start address field. We also need to set the “Loading address” to reflect this, so you should put 0x1FFF0000 there too.
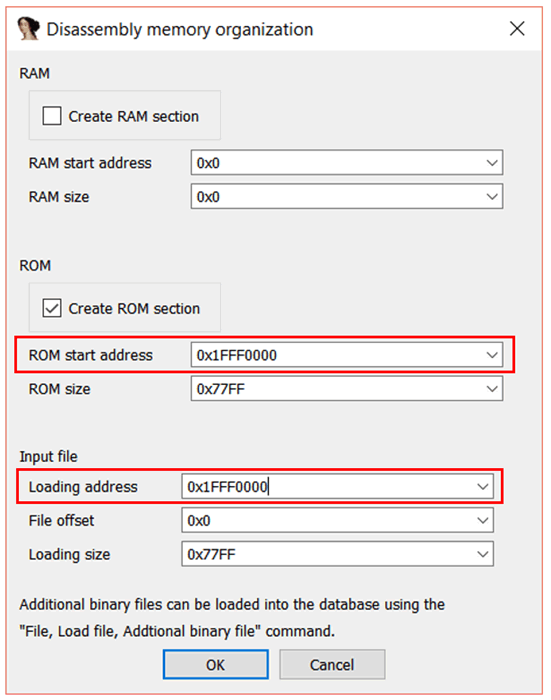
Click “OK”, and you’ll probably get a little pop up reminding you that you can switch between ARM and Thumb instructions with Alt+G. That’s also a good trick to know sometimes, and it’s not particularly intuitive, so let’s also go through that now.
Once the binary is loaded, if you click an address (let’s say, for this example, it’s the binary base at 0x1FFF0000) and press Alt+G, and the “Segment Register Value” window will pop up.
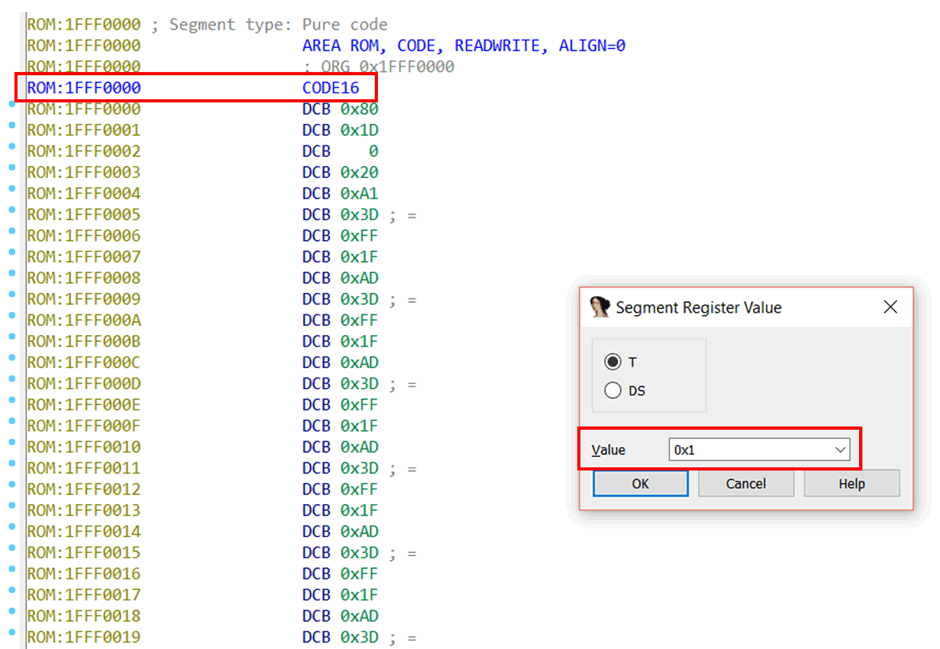
The “Value” of 0x1 means that code after this point (0x1FFF0000) will be treated as Thumb code. This mirrors the “T” flag in the ARM processor status register – a “T” flag set to 1 means that Thumb code is being executed, and a flag of 0 mean ARM code is being executed.
The note CODE16 will be put at that address, too, just to remind you. If it’s set to 0x0, it will be treated as ARM. In that case, CODE32 would be put there.
You could click to any other address later in the file and set the value to 0x0, and code after that point would be treated as ARM. But anyway, we don’t want to do that, we want everything treated as Thumb, so it’s set to 0x1.
Dude, where’s my entry point?
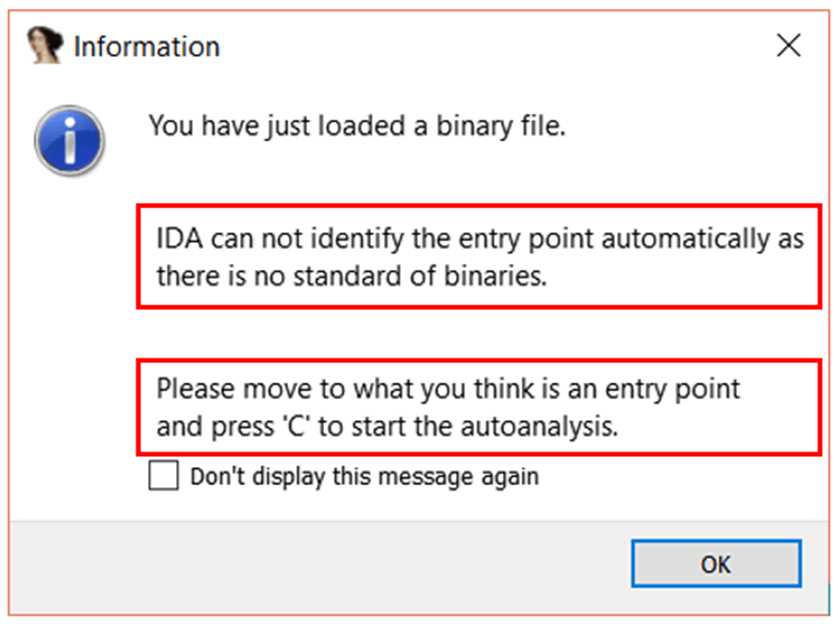
Ok IDA, let’s do that.
We can figure out the entry point by looking at the interrupt vector table. We just need to know which entry in the table is the Reset vector, because the Reset vector is our entry point. The Reset vector is the address from which the CPU will start executing code when the device – yep, you guessed it – resets.
The STM32F405 has a Cortex-M4 core, so we can Google for the Cortex-M4 vector table. In the Cortex-M4 Devices Generic Users Guide, we find this:

That’s interesting; let’s remember that. And also this:
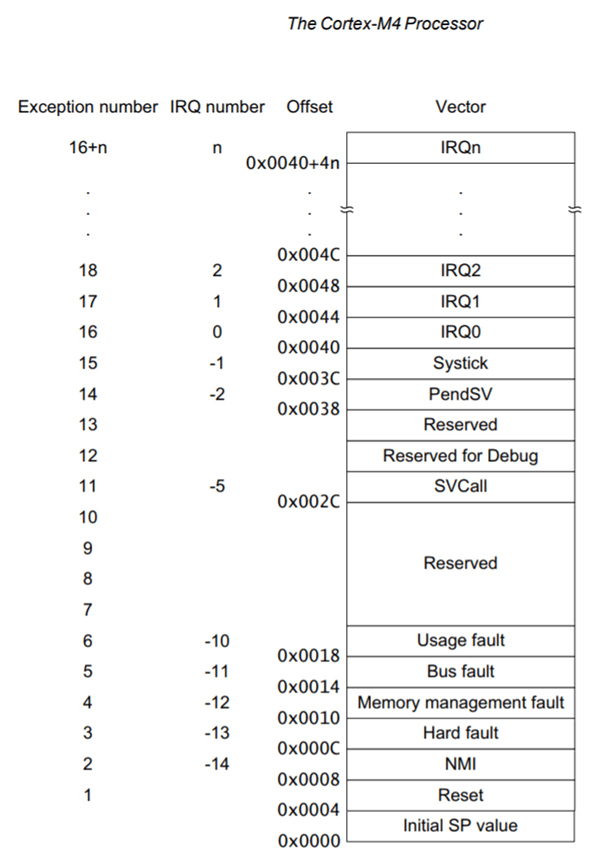
This helpful table shows that the pointer at offset 0x0 is the initial stack pointer position, the pointer at offset 0x4 is the Reset vector, the pointer at offset 0x8 is the Non-Maskable Interrupt, etc. The Reset vector is the address that the processor will start executing code from when it starts.
In IDA, we can define the data at addresses 0x0, 0x4, 0x8, etc as a “double words” (32 bits wide). Right-click on the byte at address 0x1FFF0000 and click “Double word”, then do the same at 0x1FFF0004, etc.

Have a look at what we start getting in the image below. I’ve added the comments myself. These look pretty sensible. The initial stack pointer value at the 0x0 offset is pointing into a chunk of memory we know is SRAM (we know this because we read it in the datasheet), so that makes sense.
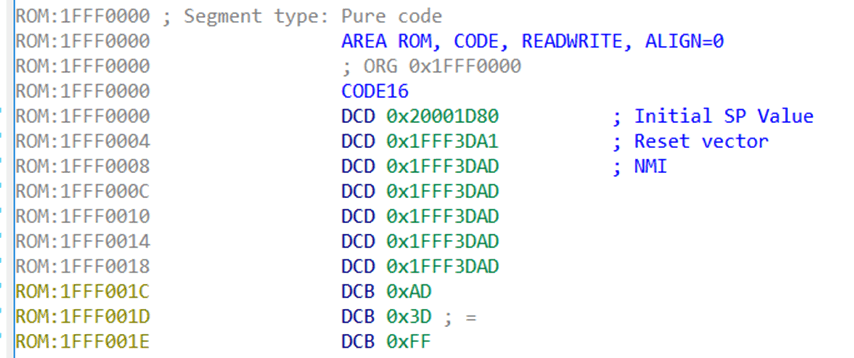
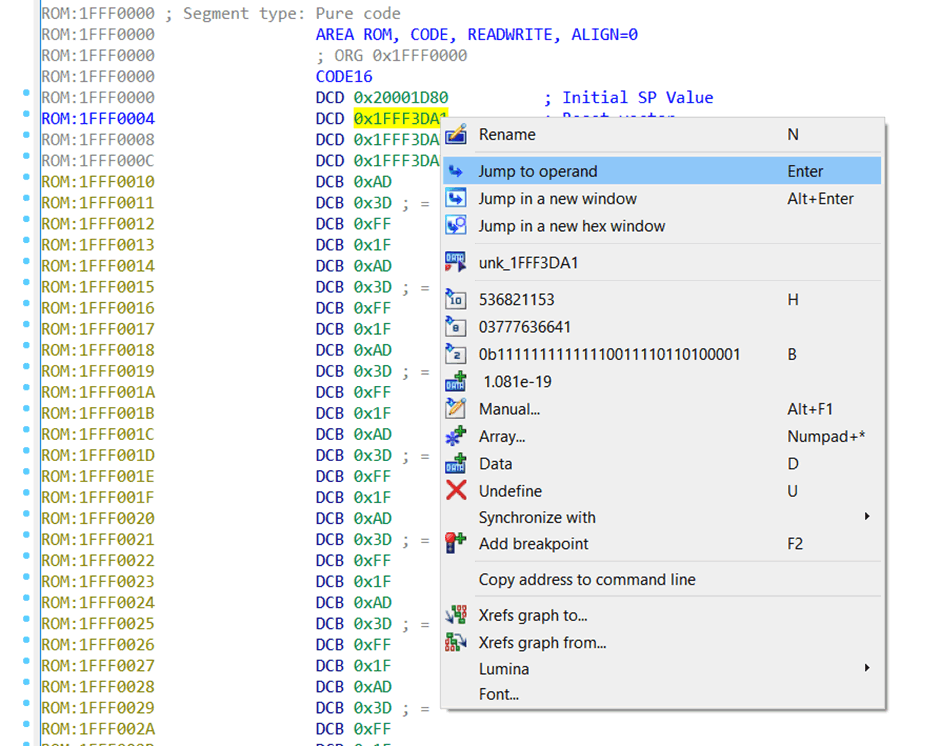
The Reset vector, 0x1FFF3DA1, also makes sense. So let’s jump to that position in IDA. Either highlight it and press “Enter”, or right-click and choose “Jump to operand”.
But remember what the Cortex-M4 manual said earlier! In Thumb mode, the least-significant bit of the Reset vector has 1 added to it. So, the actual Reset vector is (Reset vector – 1).

Notice how the IDA “stripe” (at the top) is totally mustard-coloured at this point – this just means nothing in the file is defined as anything so far. We’re about to change that.
Click to the address of the Reset vector minus 1, press “C”, and IDA will start disassembling.
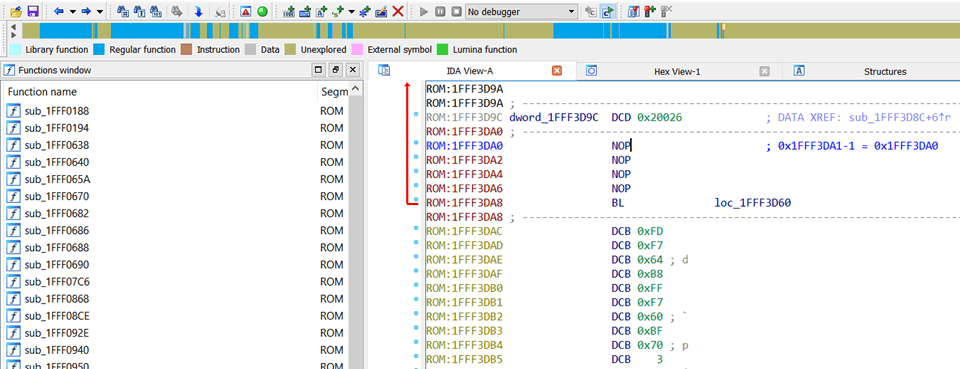
Wehay, that looks sensible. Lots of subroutines have been defined, so there’s quite a bit of blue up there in the IDA “stripe”. Continue in that vein for all other unique pointers in the vector table, and you’ll see more blue emerge.

From there you can start to poke at the intricate inner-workings of the firmware.
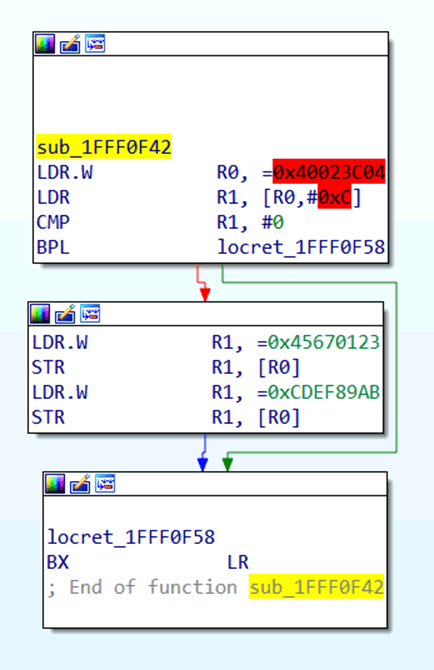
Pokey-pokey. Let’s have a quick look at this subroutine, just to get you on your way. In this subroutine, you can see that the value 0x40023C04 is being loaded into R0, then the values 0x45670123 and 0xCDEF89AB are being written to the memory at 0x40023C04 sequentially.
Red-highlighted addresses refer to memory which is going to be accessed, which is not mapped in the IDA file. So there’s no memory at 0x40023C04 mapped in the current IDA file. You don’t really need to map it, but you may want to look up what it’s for in the datasheet.
By looking at the STM32F4 datasheet, we can see that 0x40023C04 refers to some address within the Flash Interface Registers memory segment:

And offset 0x4 from the 0x40023C00 base refers to the Flash key register (FLASH_KEYR).
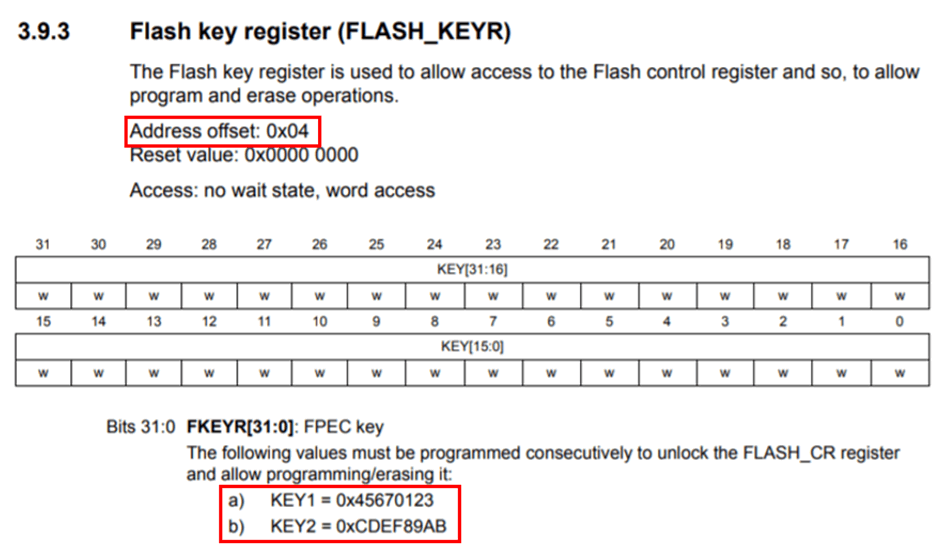
Ah look, there’s the 0x45670123 and 0xCDEF89AB values in the datasheet – they’re keys to unlock the Flash control register. So that’s what this subroutine does. Cool.
Remember to keep your datasheet handy. You are almost certainly going to need it.
IDA Scripts
There tend to be useful IDA scripts in awkward corners of the web, you can use when working with embedded firmware in IDA. IDA Python Embedded Toolkit is one of the more well-known collections, which can make reversing some bare-metal firmware easier. But in general, googling for the specific chip and/or series you’re working with might turn up some gold, and save you a lot of time. There’s lots of idiosyncratic code out there, for helping to RE the firmware of weird chips.
Conclusions
There are lots of ways to skin a cat. Always remember the context of the firmware you’re working with. Don’t rely on binwalk for everything. When in doubt, use different search engines. Learn Russian and Chinese. Get used to spending hours miserably poring over hex bytes. It’s always worth it in the end.
转载来源 https://www.pentestpartners.com/security-blog/how-to-do-firmware-analysis-tools-tips-and-tricks/